Migratory waterfowl have been implicated as natural reservoirs, mixing vessels, and intercontinental vectors for various serotypes of avian viruses. However, the degree and extant of the influence of waterfowl in global disease propagation is poorly understood and is an active area of research. This case study uses automatically generated agent-based model of high risk species of migratory waterfowl to conduct conducting detailed and comprehensive simulation-based epidemiological analyses to assess the role of migratory species in intercontinental spread and ecology of avian influenza caused by H5N1 serotype in specific. SEARUMS has been used to conduct various epidemiological simulations, visualize analytics from the simulations, and draw suitable inferences.
The hypothesis for this case study is that the automatically generated model of high risk waterfowl species will reflect spread of highly pathogenic H5N1 strain, originally isolated in Southeast Asia, to various human outbreak regions as reported by the World Health Organization (WHO) and shown in the figure below. Testing this hypothesis will accomplish verification and validation of the model and thereby the automatic model generation methodology. Furthermore, it adds further evidence to support the role of migratory species in intercontinental spread of H5N1.
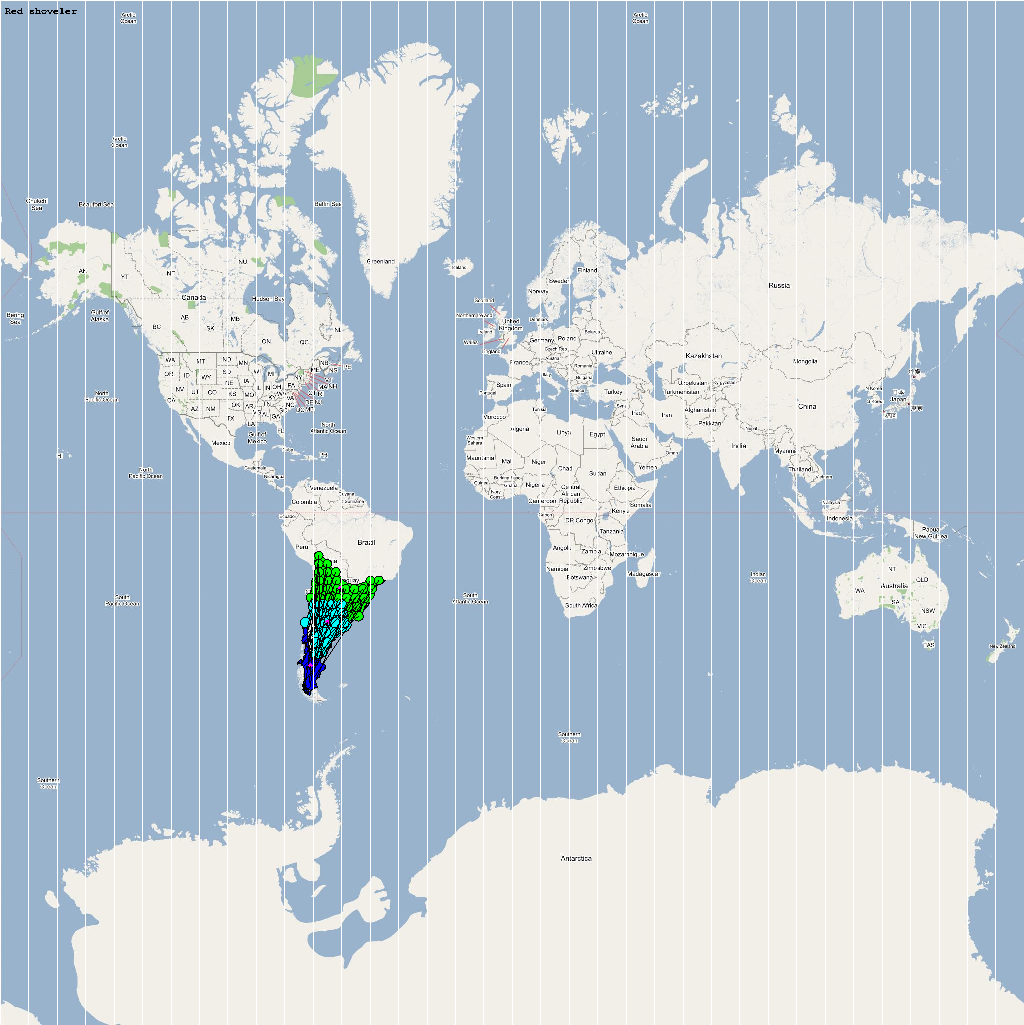
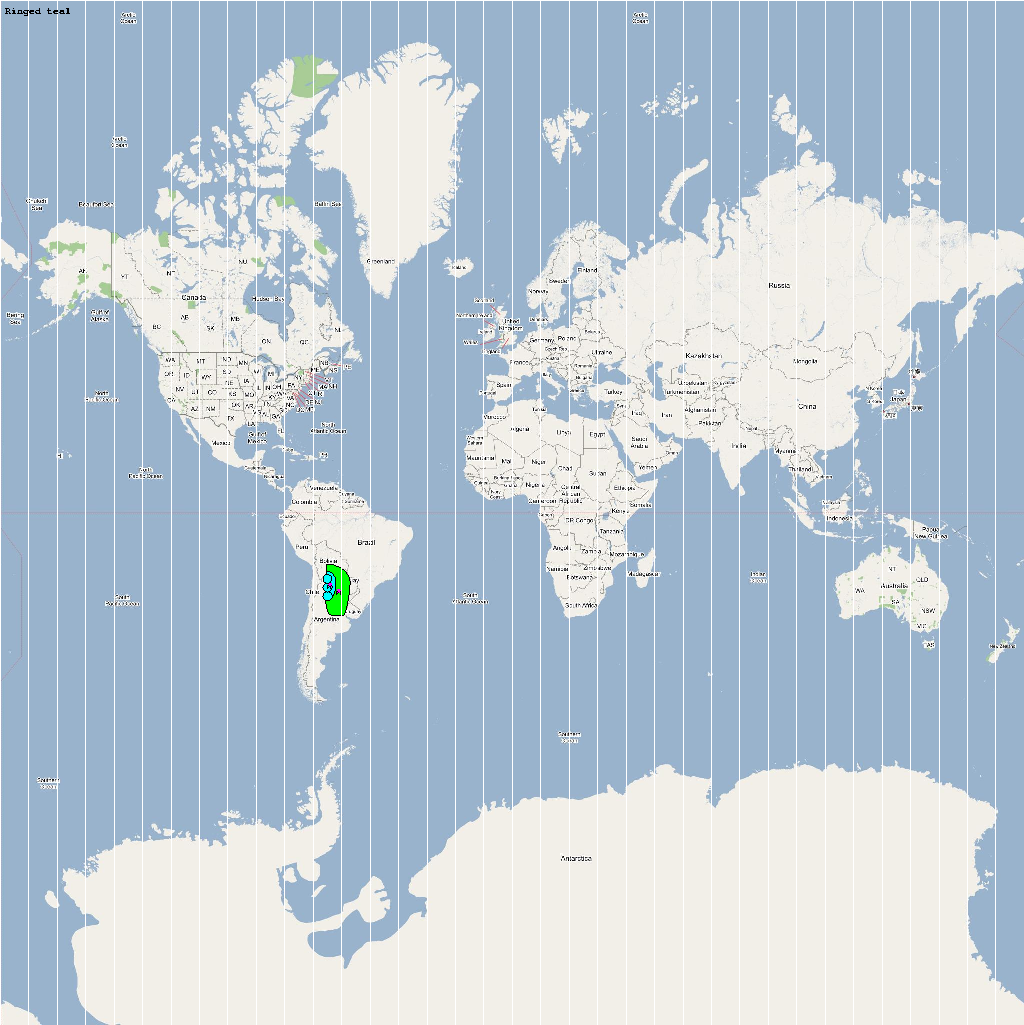
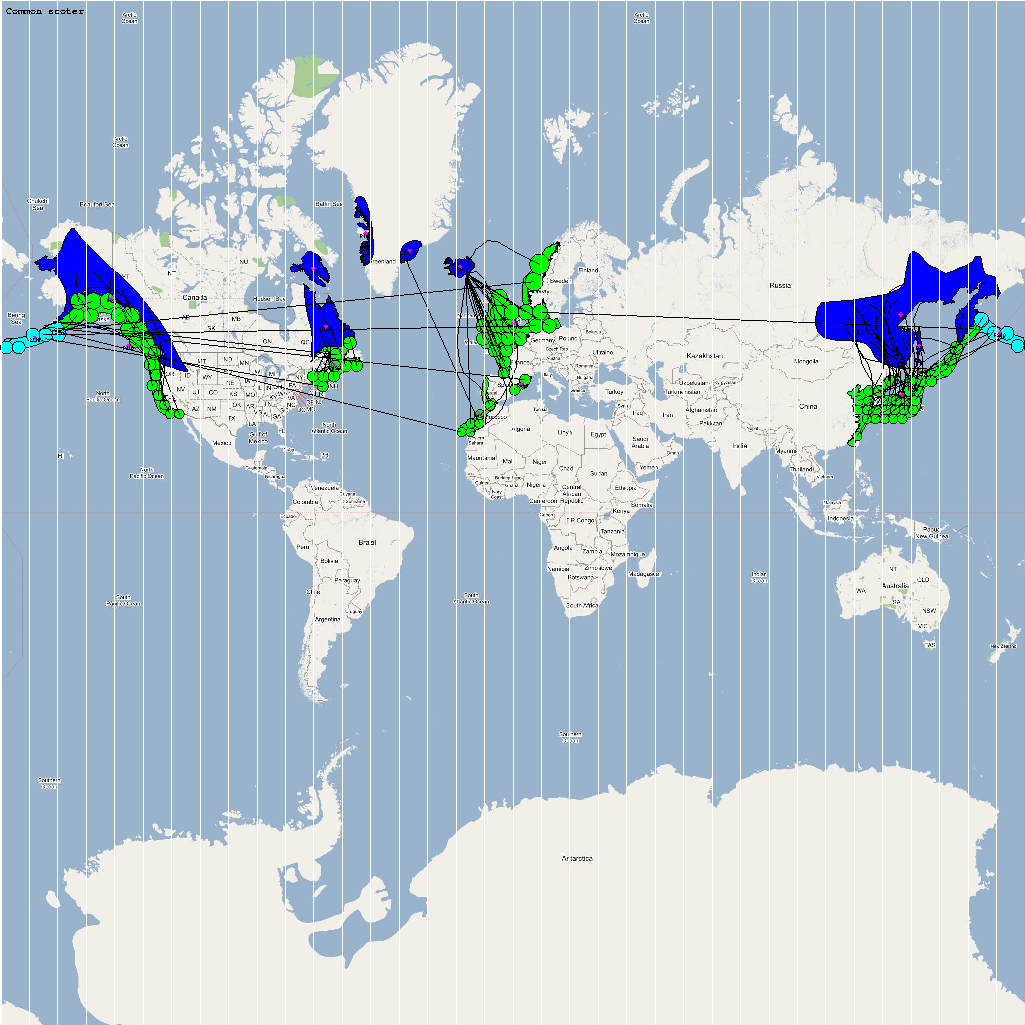
An automatic model generation methodology that transforms Geographic Information System (GIS) datasets into SEARUMS model has been used to generate a model consisting of the following 22 species of migratory waterfowl from which H5N1 viral strains have been isolated in the past:
| Species Name | Population | Flocks/Agents | Model Image |
|---|---|---|---|
| Aix sponsa | 3500000 | 64 | Asponsa.png |
| Amazonetta brasiliensis | 110000 | 103 | Abrasili.png |
| Anas acuta | 5300000 | 372 | Aacuta.png |
| Anas bahamensis | 640000 | 78 | Abahamen.png |
| Anas platalea | 500000 | 47 | Aplatela.png |
| Anas platyrhynchos | 19000000 | 557 | Aplathyr.png |
| Anas sibilatrix | 250000 | 30 | Asibilat.png |
| Anas versicolor | 126000 | 42 | Aversico.png |
| Anser anser | 1000 | 4 | Aanser.png |
| Anser indicus | 56000 | 11 | Aindicus.png |
| Aythya ferina | 2200000 | 213 | Aferina.png |
| Aythya fuligula | 2600000 | 148 | Afuligul.png |
| Aythya marila | 1200000 | 114 | Amarila.png |
| Branta canadensis | 5500000 | 169 | Bcanaden.png |
| Callonetta leucophrys | 50000 | 3 | Cleucoph.png |
| Cygnus melanocoryphus | 50000 | 32 | Cmelanoc.png |
| Melanitta nigra | 2100000 | 96 | Mnigra.png |
| Mergellus albellus | 130000 | 71 | Malbellu.png |
| Netta peposaca | 1000000 | 26 | Npeoposac.png |
| Anas Crecca | 5900000 | 403 | Acrecca.png |
| Philomachus pugnax | 4,200,000 | 210 | Aplatyrh.png |
| Porzana pusilla | 21300 | 262 | Ppusilla.png |
A video containing images of the model of the 22 bird species in the above table (with 1 second per species) is available here: model video. The GIS data for the various species were obtained from GROMS database while migratory characteristics were obtained from BirdLife International
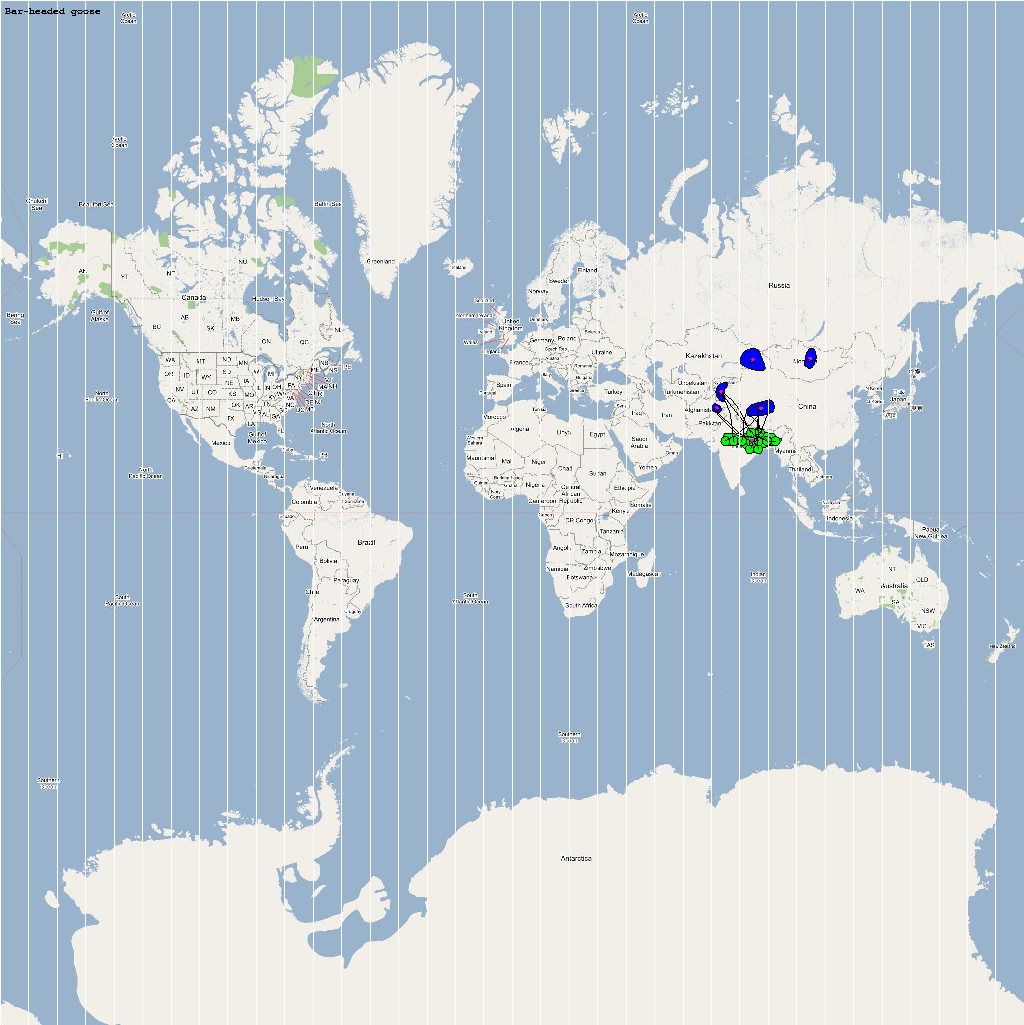
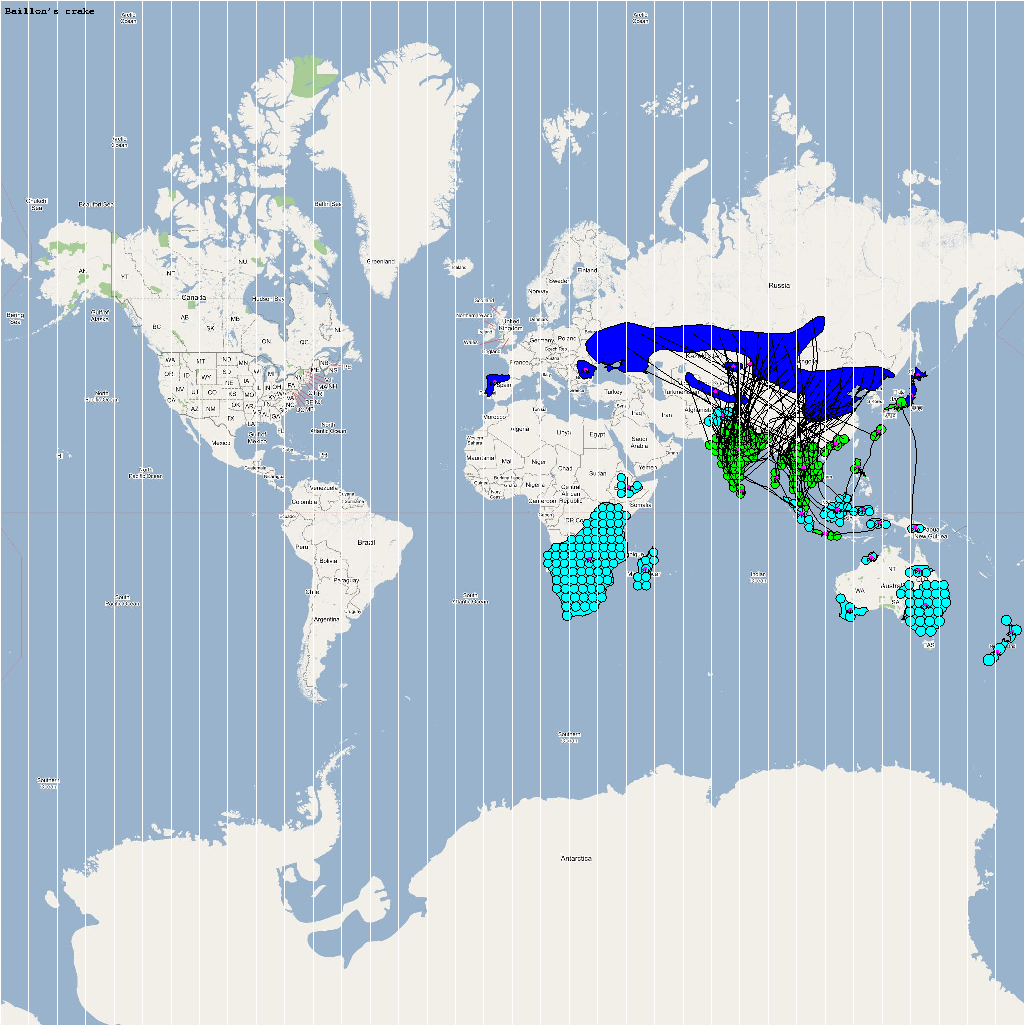
The XML
model description for various species were merged together to
obtain the final characteristic model shown in the figure below.
The various species in the model have been color coded to
distinguish them. However, migratory pathways are not shown to
improve clarity. The initial starting zone was set to correspond
to the wintering zone.
The experiments for hypothesis testing were conducted by seeding a single infection in one waterfowl flock in Vietnam (at 11° 57,71' 50" N 108° 6' 31.31"). The basic reproductive number for the infection (R0) was set to be greater than 1 to model enzootic nature of the infection. Furthermore, the disease transmission parameters were configured to reflect a Susceptible → Infected (SI) type compartmental epidemiological model. The model was simulated for a period of two years while logging the locations of various infections occurring in the model. A video illustrating the spread of infection is available via the following URL: Video of spread of infection
A video containing images of the model of the 22 bird species in the above table (with 1 second per species) is available here: model video.
A video illustrating the spread of infection is available via the following URL: Video of spread of infection
The dominant outbreaks identified from multiple stochastic simulations are plotted in the following figure. The infection locations indicate potential areas for outbreaks and increased density of outbreaks in turn increase the probability of human outbreaks. The infection locations in the figure are color coded to reflect the number of intermediate hosts to the source infection in Vietnam.
As illustrated by the above figure, the infection is carried by infected waterfowl and radiate out of Vietnam to various parts of Asia and rest of the world. The high risk areas as reported by WHO and are highlighted in bright orange in the above figure. The figure highlights the strong correlation between dense, strong outbreaks observed in the simulation and the regions with human outbreaks reported by WHO. This observation provides strong evidence for increased confidence in the validity of the model and role of migratory waterfowl in the global spread of avian influenza.
Furthermore, as shown in the figure, infections into North America involve a large number of intermediate hosts suggesting that the infections are weak. However, the primary entry locations near the Gulf of Alaska, a known high risk area, consistently show sufficiently strong infections. This observation is supported by other investigations and consequently further increases confidence in the model and analysis. The infections into South America are propagated from North American infections and are significantly distant from the source infections in Vietnam. Infections into South America occurred only in the second year of migration cycle (see video for details). Analytics from the simulation suggest that the viral strains in South America lag behind primary infections in Southeast Asia by more than a year. A similar inference was drawn by other investigators who use bioinformatics-based analysis of influenza A viruses to show more than a year's lag between viruses in Southeast Asia and South America.
These experiments provide evidence to support and accept the hypothesis that the automatically generated model will reflect spread of highly pathogenic H5N1 strain, originally isolated in Southeast Asia, to various human outbreak regions as reported by the World Health Organization. More importantly, the experiments significantly increase confidence in the validity of the model as well as verify and validate the proposed model generation methodology. Furthermore, the experiments add credence to the significance of migratory waterfowl in the global ecology of avian influenza.
The validated methodology can now be used for other simulation-based epidemiological and ecological analyses. Specifically, such simulation-based analyses provides a powerful approach for design and assessment of various prophylactic and containment strategies. Furthermore, outbreak information can be used to focusing surveillance efforts. Simulation-based observations about influence of other migratory waterfowl species on the spread of infections can be used to identify other influential or high-risk species. This investigation used avian influenza as the primary case study for verification and validation of the proposed approach. However, the same methodology can be applied analyze ecological impact of other migratory species. This investigation provides support that the proposed methodology is an effective approach for using surveillance-based GIS datasets for a broad range of simulation-based epidemiological and ecological analysis to combat emergent zoonotic diseases.