Supplementary Materials
Enhancing Temporo-Geospatial Epidemiological Analysis of Avian Influenza using Phylogeography
by Dhananjai M. RaoSummary
Background
Intercontinental migratory waterfowl are the primary vectors for dispersion of H5N1 viruses and have been implicated in several zoonotic epidemics and pandemics. Recent investigations have established that with a single mutation, the virus gains the ability to transmit between humans. Consequently, there is a hightened urgency to identify innovative approaches to proactively mitigate emergent epidemics. Accordingly, a novel methodology combining temporo-geospatial epidemiology and phylogeographic analysis of viral strains is proposed to identify critical epicenters and epidemic pathways along with high risk candidate regions for increased surveillance.
Results
Infection transmission pathways between 22 high risk waterfowl species obtained from epidemiological analysis. Dominant pathways were identified through annotation using phylogeographical data computed from the phylogram of 2417 H5N1 HA isolates (from GISAID EpiFlu database). Annotation of infection pathways in turn delinated 23 influential clades out of 130 clades in the phylogram.
Conclusions
The phylogeographic analyses provides strong cross-validation of epidemic pathways and identifies the dominant pathways for use in other epidemiological and prophylactic studies. The temporo-geospatial characteristics of infection transmission provides corroborating, but novel evidence for rapid genesis of H5N1 lineages in S.E. Asia. The proposed method pinpoints several regions, particularly in the southern hemisphere, as candidates for increased surveillance.
High Risk Species used for Analysis
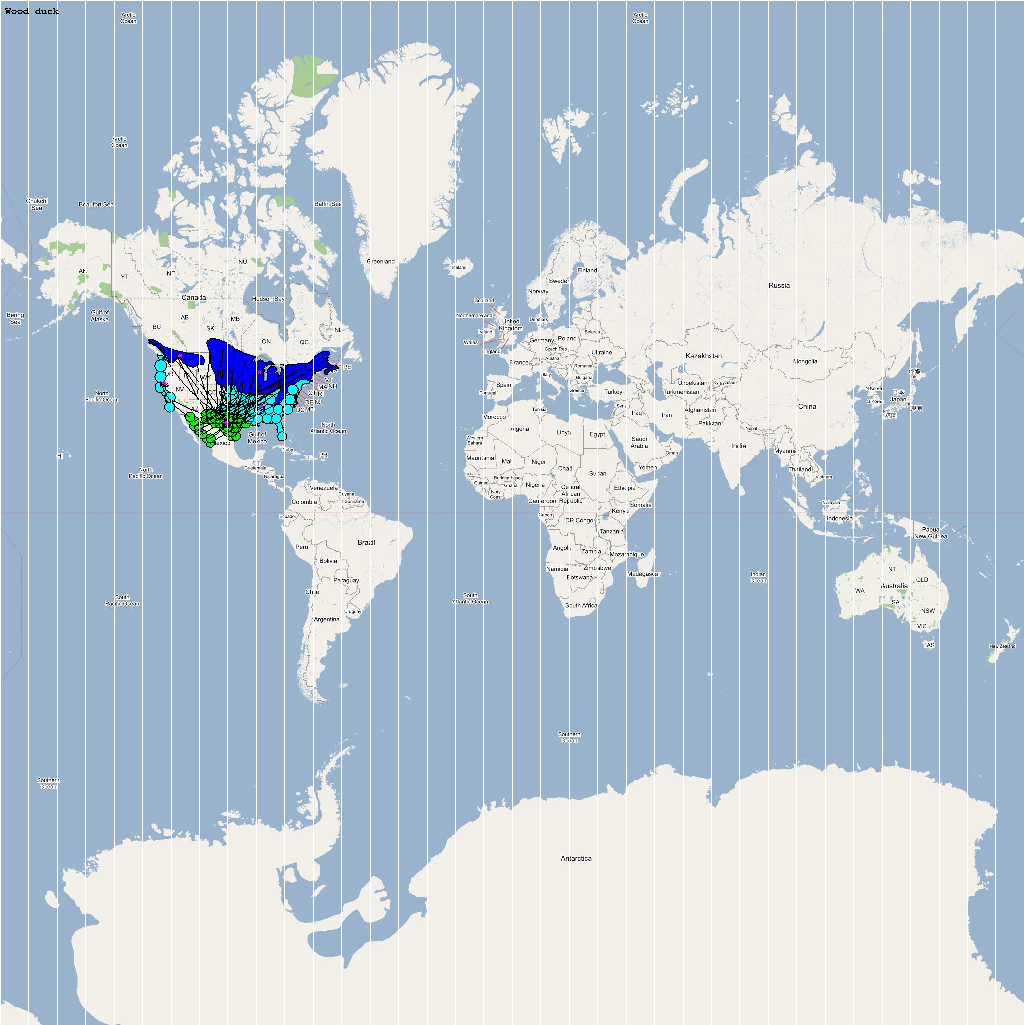
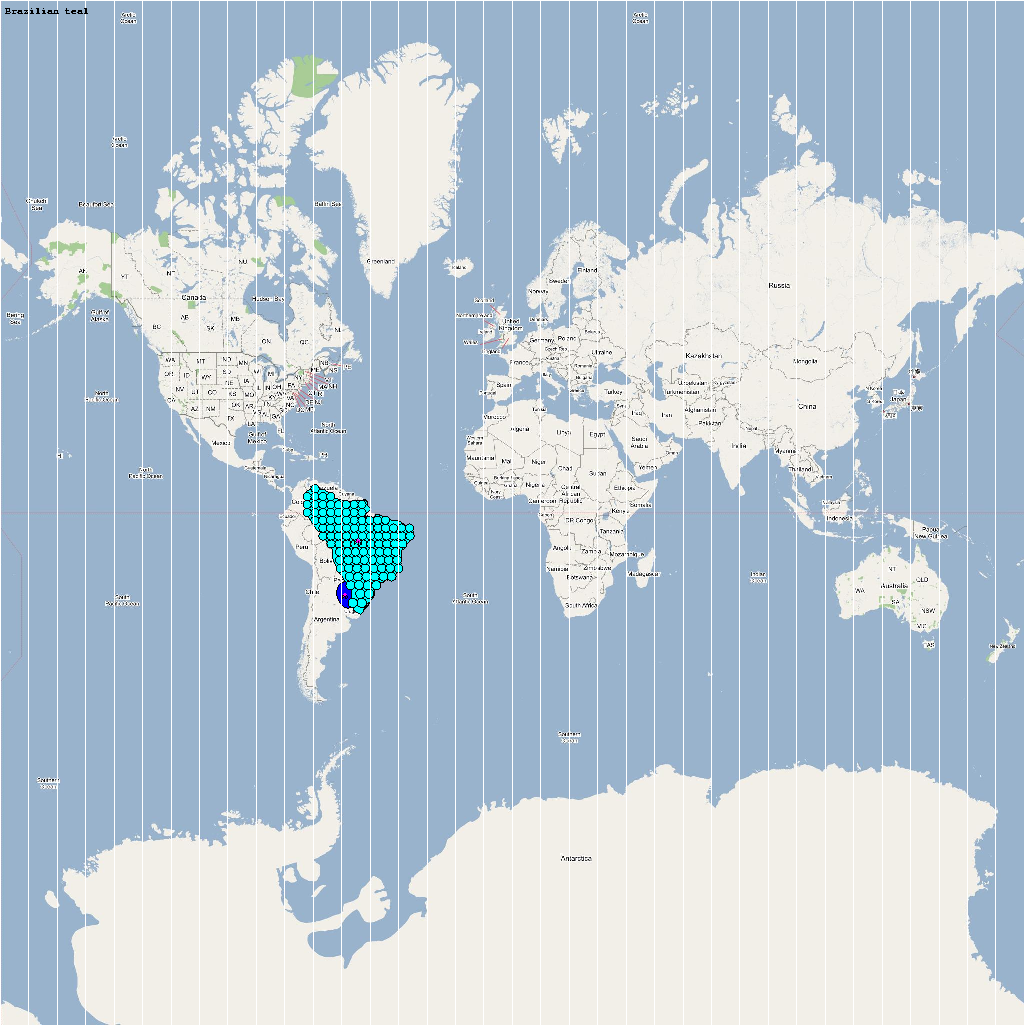
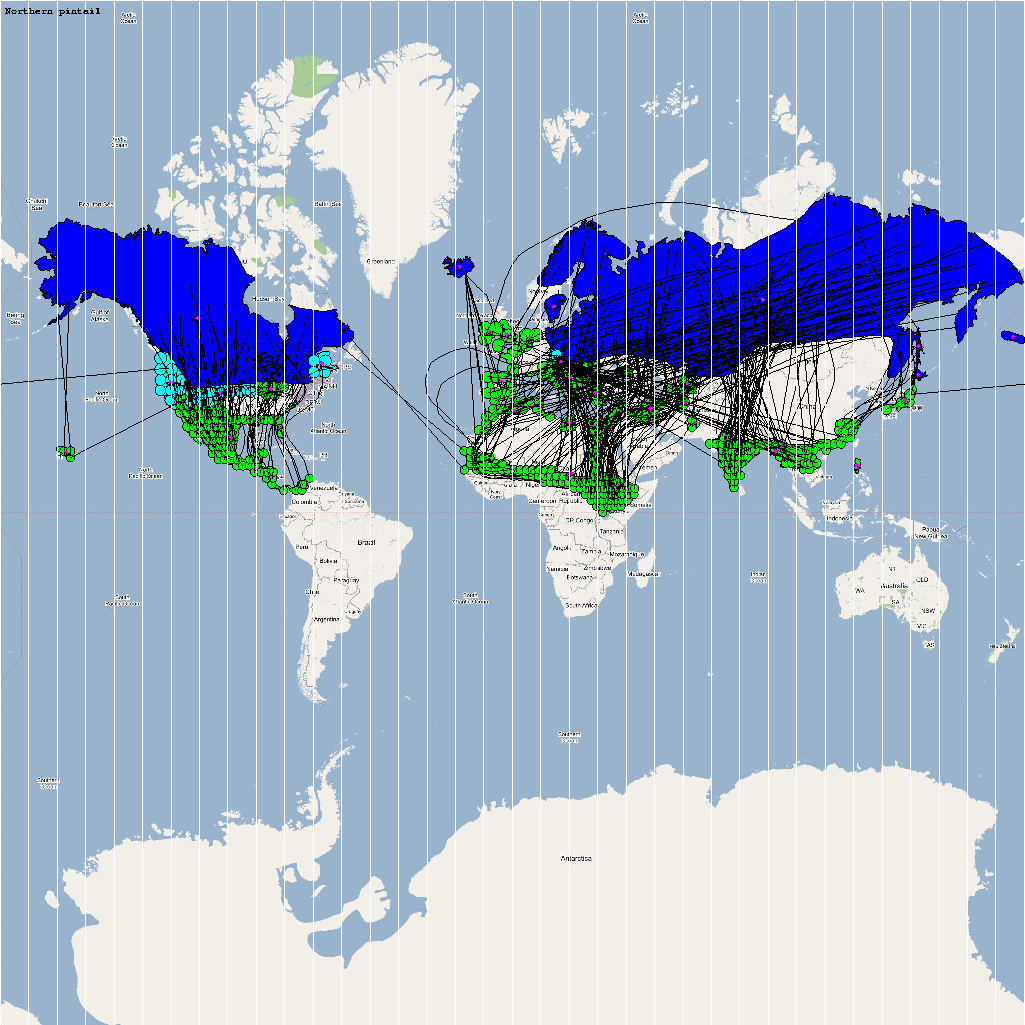
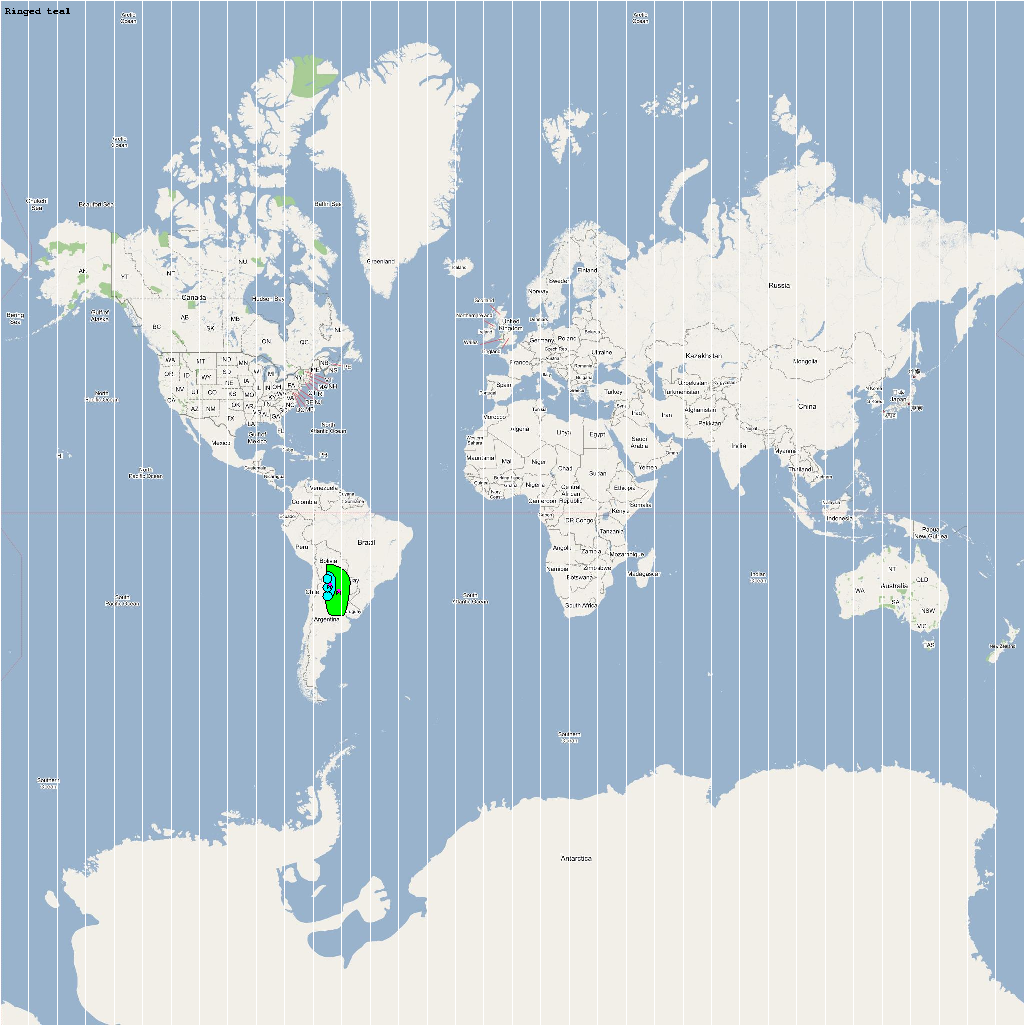
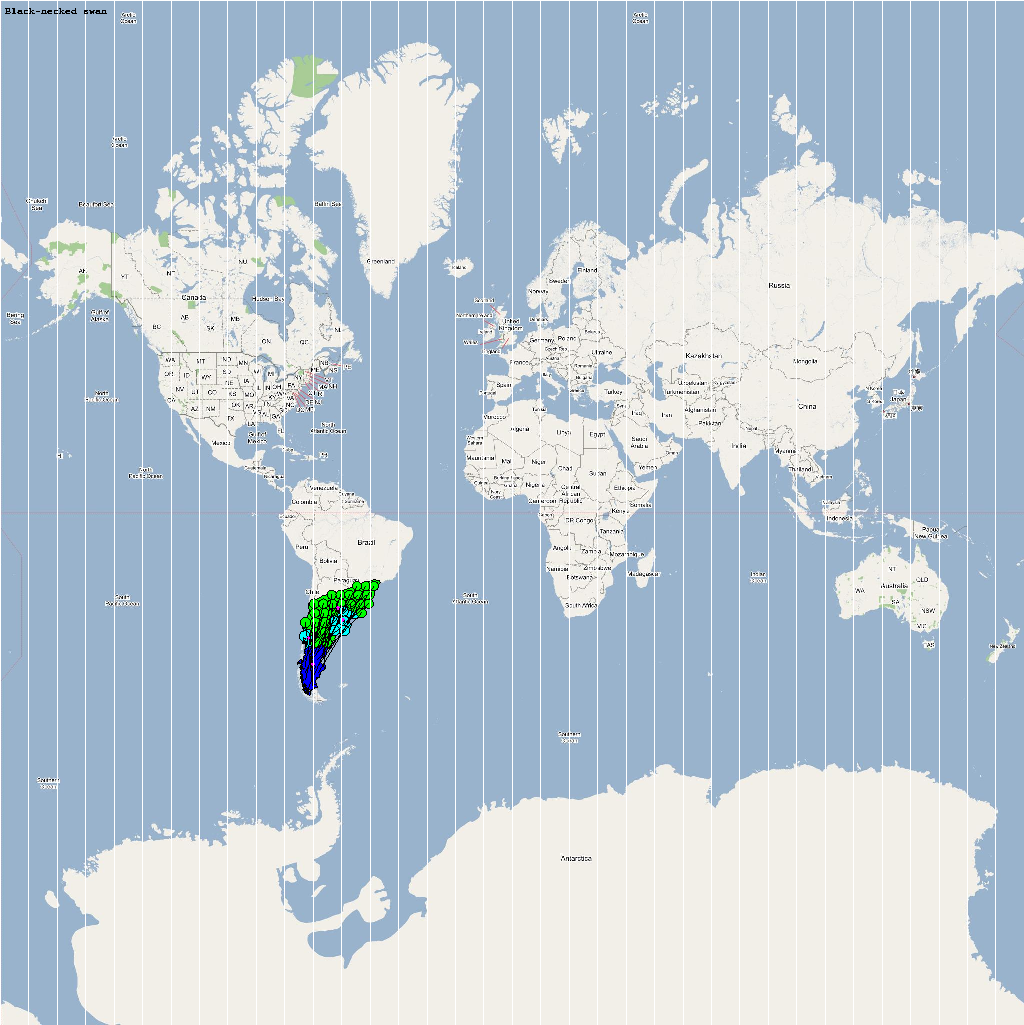
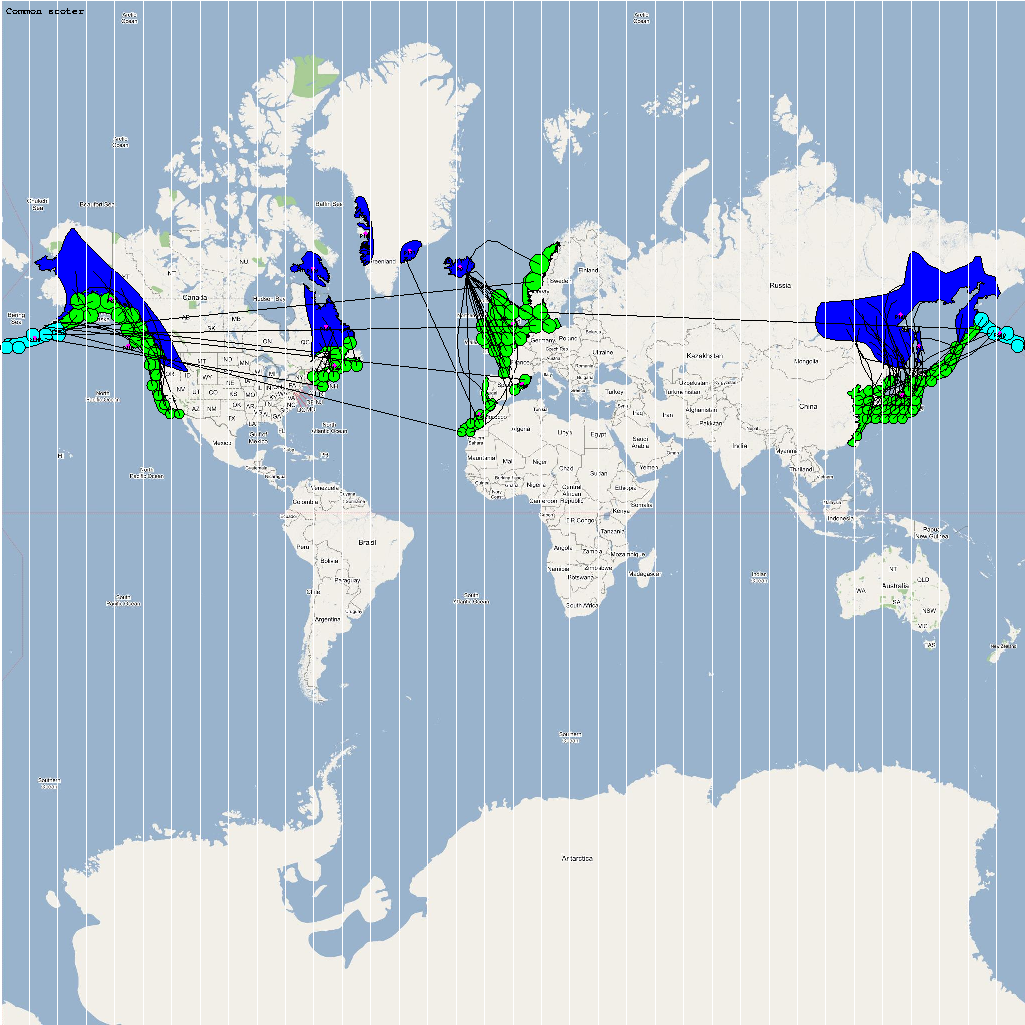
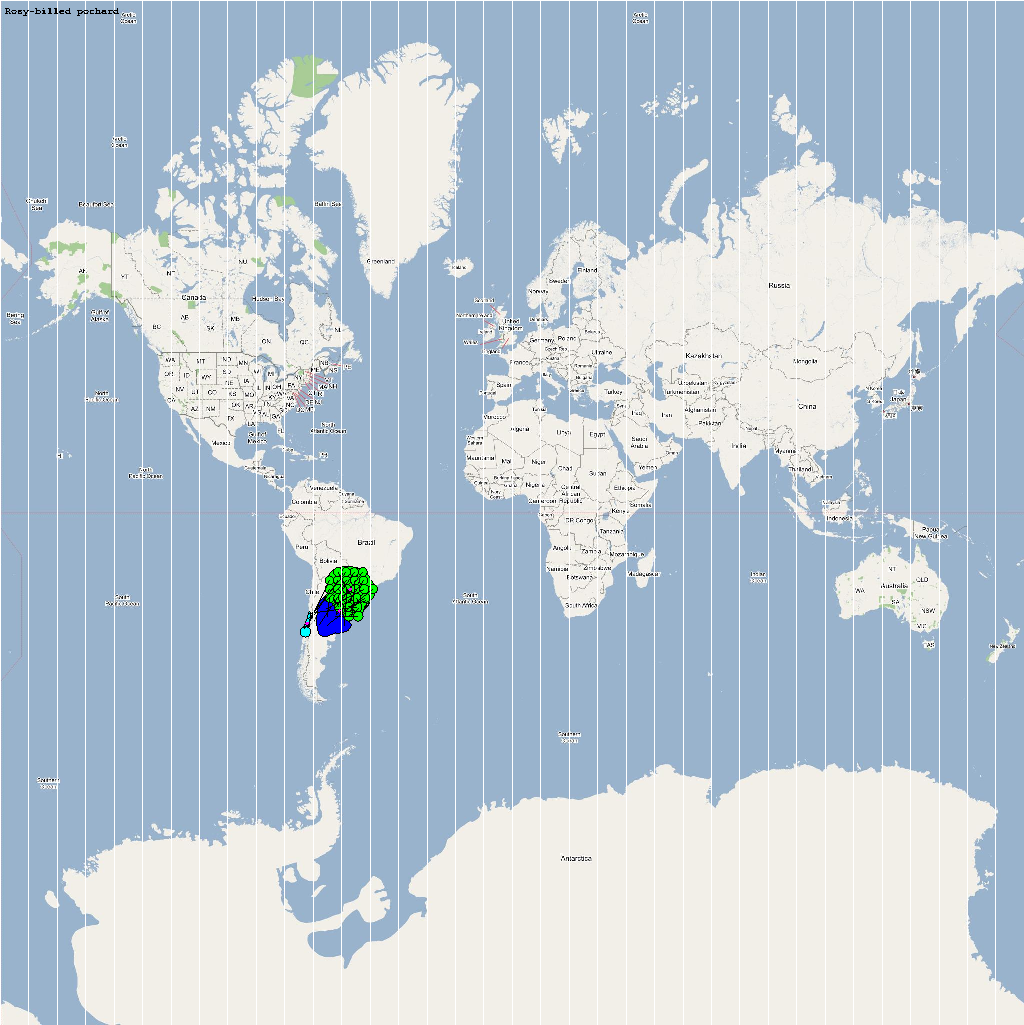
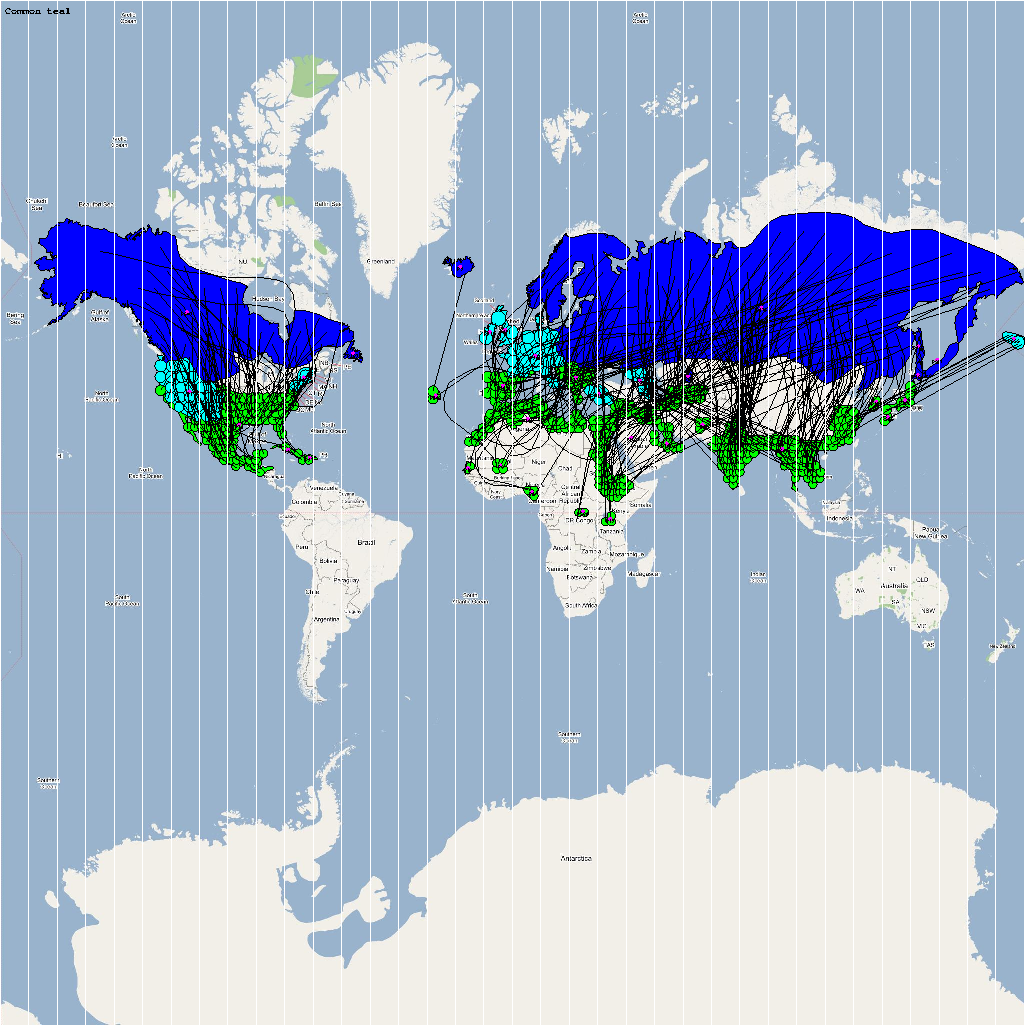
An automatic model generation methodology that transforms Geographic Information System (GIS) datasets into SEARUMS model has been used to generate a model consisting of the following 22 high risk waterfowl species from which H5N1 viral strains have been isolated in the past:
| Species Name | Population | Flocks/Agents | Model Image |
|---|---|---|---|
| Aix sponsa | 3500000 | 64 | Asponsa.png |
| Amazonetta brasiliensis | 110000 | 103 | Abrasili.png |
| Anas acuta | 5300000 | 372 | Aacuta.png |
| Anas bahamensis | 640000 | 78 | Abahamen.png |
| Anas platalea | 500000 | 47 | Aplatela.png |
| Anas platyrhynchos | 19000000 | 557 | Aplathyr.png |
| Anas sibilatrix | 250000 | 30 | Asibilat.png |
| Anas versicolor | 126000 | 42 | Aversico.png |
| Anser anser | 1000 | 4 | Aanser.png |
| Anser indicus | 56000 | 11 | Aindicus.png |
| Aythya ferina | 2200000 | 213 | Aferina.png |
| Aythya fuligula | 2600000 | 148 | Afuligul.png |
| Aythya marila | 1200000 | 114 | Amarila.png |
| Branta canadensis | 5500000 | 169 | Bcanaden.png |
| Callonetta leucophrys | 50000 | 3 | Cleucoph.png |
| Cygnus melanocoryphus | 50000 | 32 | Cmelanoc.png |
| Melanitta nigra | 2100000 | 96 | Mnigra.png |
| Mergellus albellus | 130000 | 71 | Malbellu.png |
| Netta peposaca | 1000000 | 26 | Npeoposac.png |
| Anas Crecca | 5900000 | 403 | Acrecca.png |
| Philomachus pugnax | 4,200,000 | 210 | Aplatyrh.png |
| Porzana pusilla | 21300 | 262 | Ppusilla.png |
Model video
A video containing images of the model of the 22 bird species in the above table (with 1 second per species) is available here: model video. The GIS data for the various species were manually obtained from GROMS database while migratory characteristics were obtained from BirdLife International
Phase #1: Epidemiological Analysis Dataset
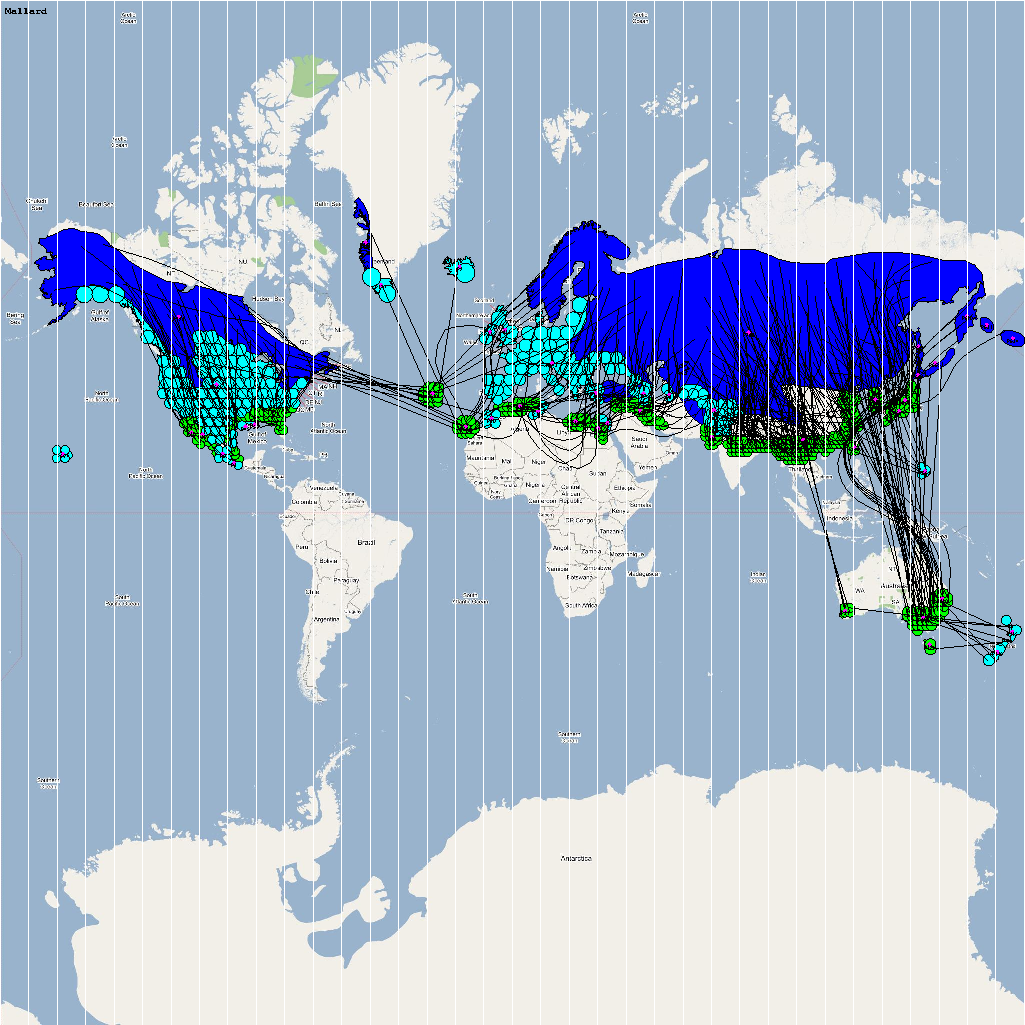
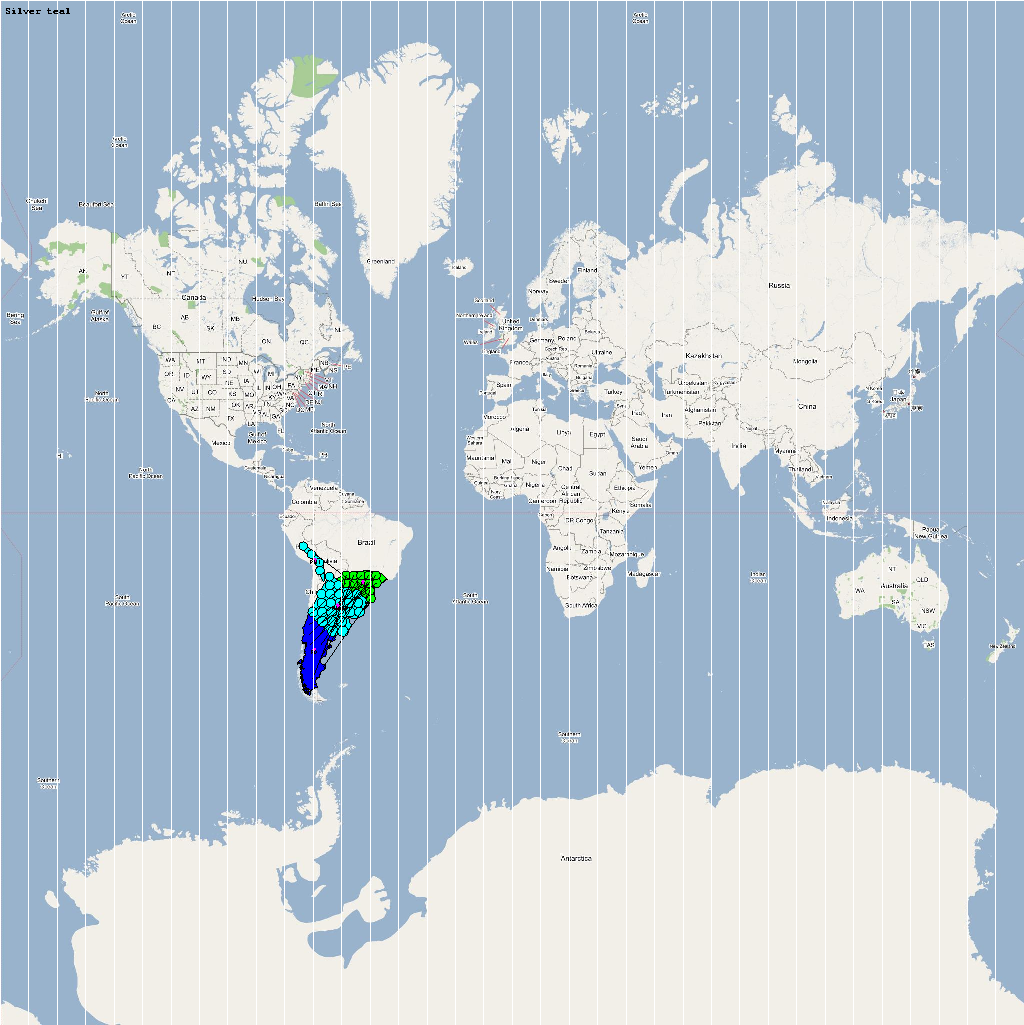
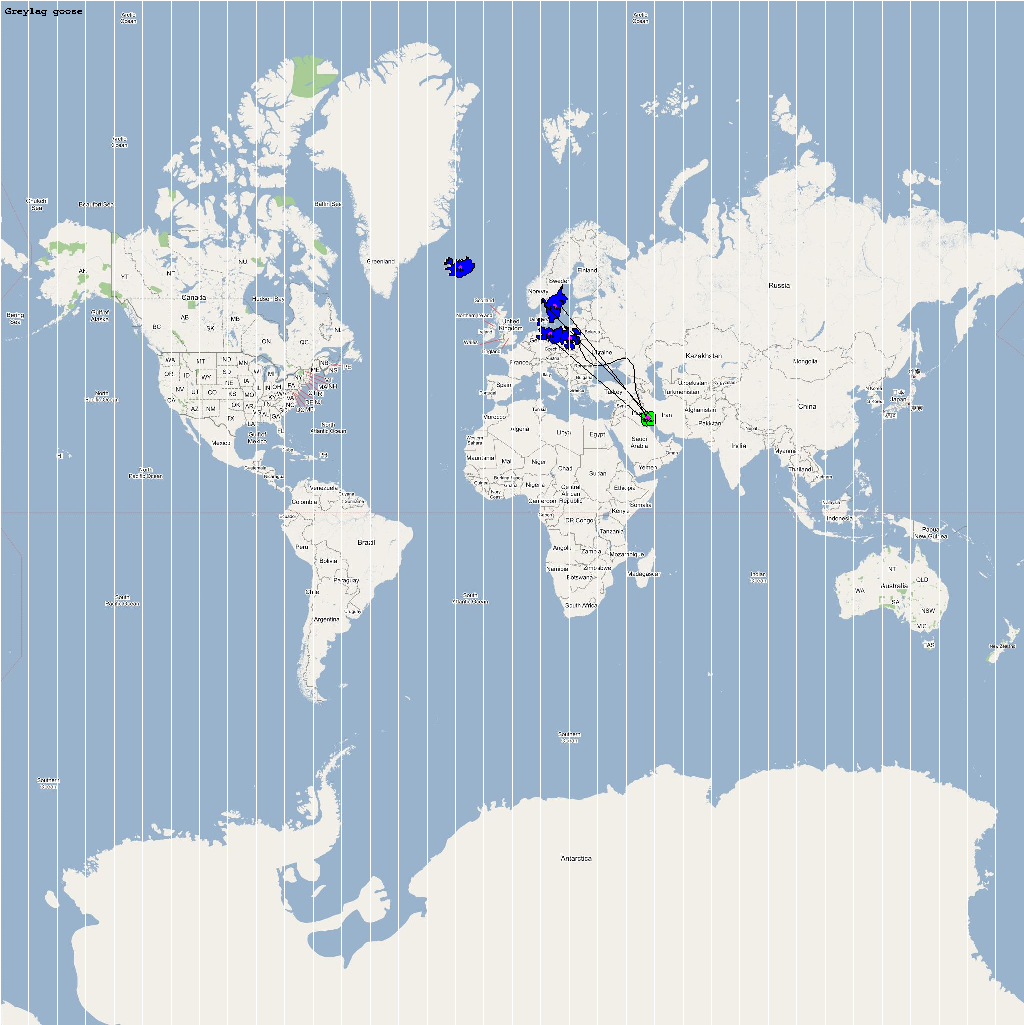
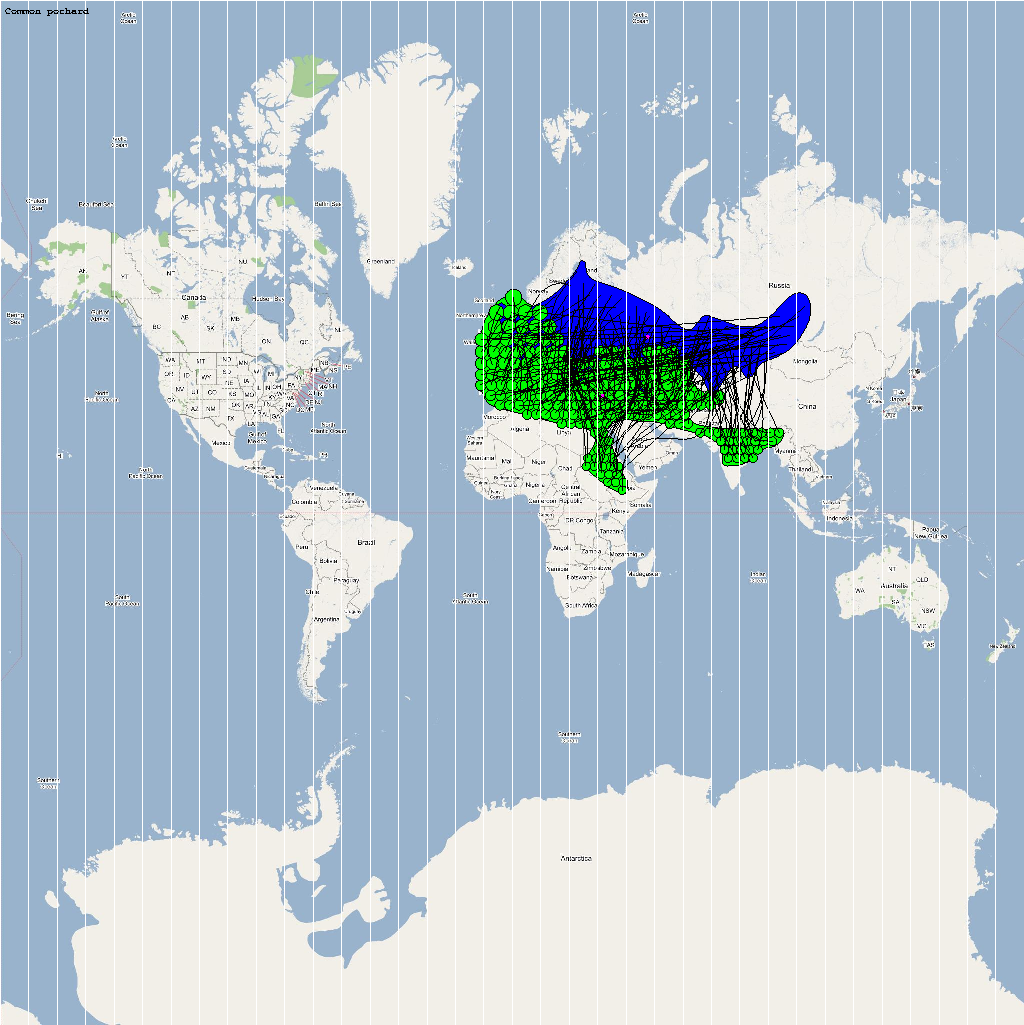
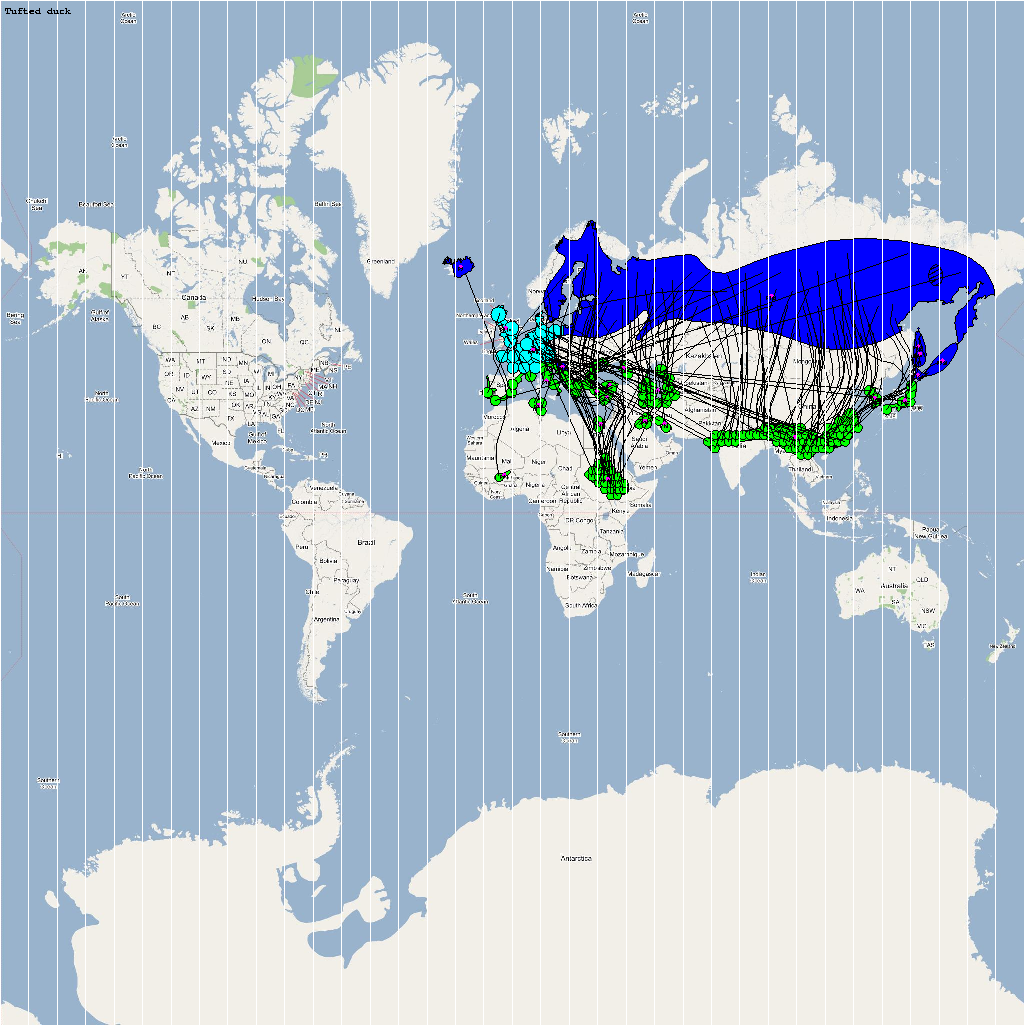
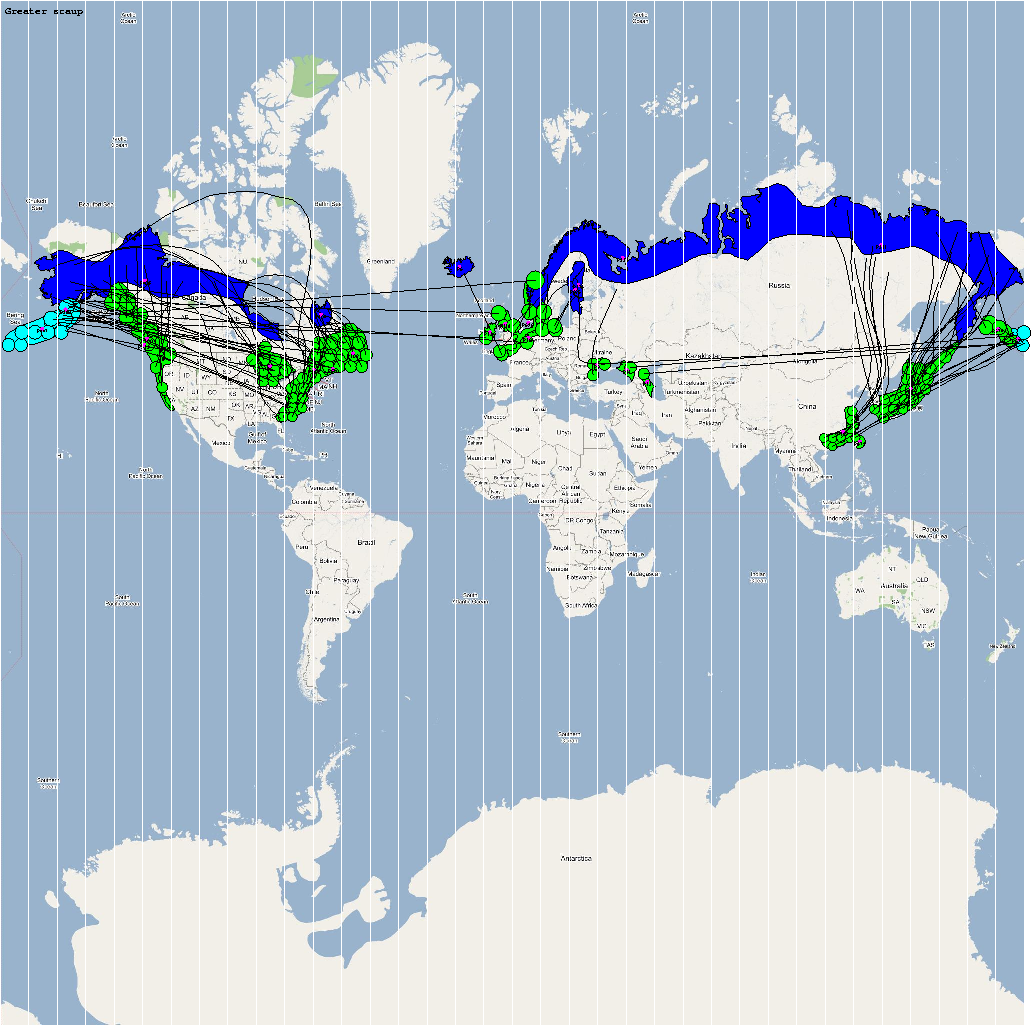
The XML model description for various species were merged together to obtain the final characteristic model shown in the figure below. The various species in the model have been color coded to distinguish them. However, migratory pathways are not shown to improve clarity. The initial starting zone was set to correspond to the wintering zone. The positions of the flocks in summering and wintering zones are shown in the images below:
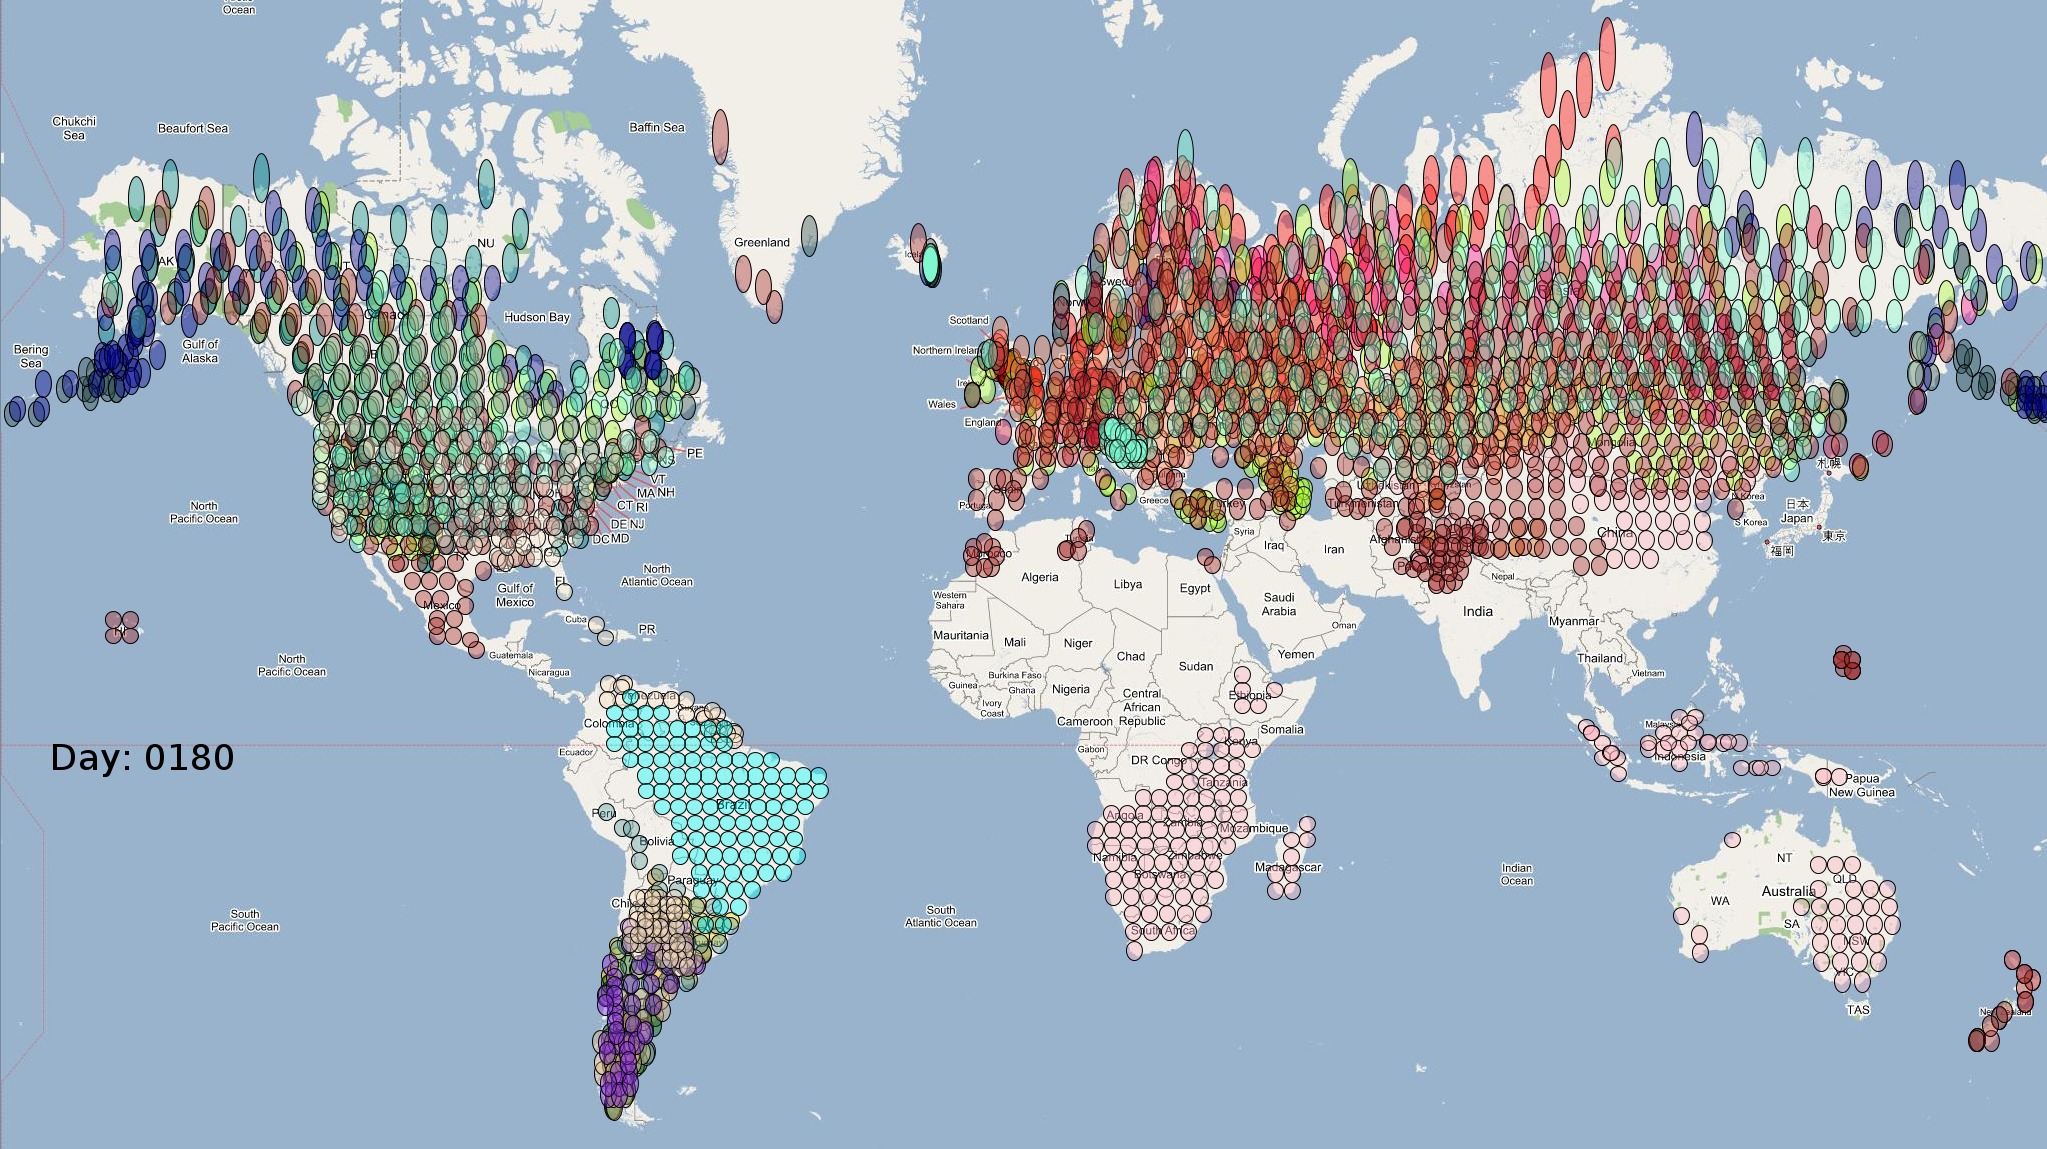
The epidemiological analysis to determine infection spread patterns was conducted by seeding a single infection in one waterfowl flock in Guangdong, China (at 23° 21' 36.53" N 113° 36' 25.89" E). The model was configured to have a basic reproductive number for the infection (R0) to be greater than 1 to reflect enzootic nature of the infection. Furthermore, the disease transmission parameters were configured to reflect a Susceptible → Infected (SI) type compartmental epidemiological model. The model was simulated for a period of three years while logging the locations of various infections occurring in the model. A video illustrating the spread of infection is available via the following URL: Video of spread of infection
Epidemiological analysis and Infection Graph
The dominant infection locations observed in several objects are shown in the second figure below. The locations the figure are color coded to reflect the number of intermediate hosts to the source infection in Guangdong, China (at 23° 21'36.53"N, 113° 36'25.89"E), corresponding to the root (A/goose/Guangdong/1996) of the revised H5N1 nomenclature phylogram. The locations of various infection transmissions indicate potential areas for secondary outbreaks and increased density of outbreaks in turn increase the probability of human outbreaks. The high risk areas as reported by WHO are highlighted in bright orange in the second figure. The figures highlights the overlap between dense outbreaks identified by epidemiological analysis and the regions with observed human cases reported by WHO.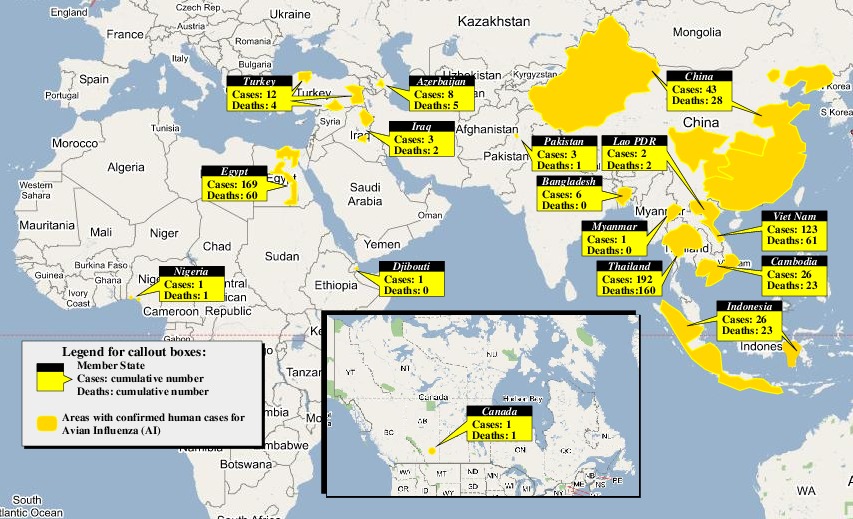
Videos
- A video containing images of the model of the 22 bird species used in this study (with 1 second per species) is available here: model video.
- A video illustrating the spread of infection is available via the following URL: Video of spread of infection.
Phase #2: Phylogeographic Analysis Datasets
The phylogram generation procedure adopted by WHO/OIE/FAO H5N1 Evolution Working Group has been utilized to generate a phylogenetic tree using 2,417 H5N1-Hemmagglutinin (HA) segments. The viral strains were obtained from GISAID EpiFlu database by restricting the search to reads longer than 1600 nucleotides (nt), which corresponds to 90% of the open frame read length. Furthermore, the EpiFlu search query was restricted to a 3 year time period from 2006 to 2009 (inclusive) corresponding to the 3 year period used for epidemiological analysis in Phase 1. A multiple sequence alignment of the 2,417 H5N1-HA sequences was generated using MUSCLE (version 3.7) using 16 iterations. A large unrooted neighbor-joining tree of the 2,417 H5N1 HA strains was constructed using a GTR+I+Γ model in PAUP* v4.0b10. The newick form of the phylogram generated by PAUP* was used to categorize leaves into clades such that percentage pairwise nucleotide distances between and within clades are > 1.5% and < 1.5% respectively, concordant with WHO/OIE/FAO clade definition criteria.
The primary dataset of H5N1 strains used for analysis along with various resulting files are listed below:
- 2,417 H5N1 HA sequences: The primary FASTA (gzipd for reducing size) file containing the orginal H5N1 HA sequences obtained from GISAID Epiflu database (Epiflu query criteria: Minimum length > 1600 and dates between 2006 and 2009 (inclusive)).
- Multiple Sequence Alignment: The sequence alignment generated for the 2,417 H5N1 HA sequences using MUSCLE.
- Full (zoomable) phylogenetic tree (PDF): The resulting phylogenetic tree color coded to highlight the various clades in the phylogram. such that percentage pairwise nucleotide distances between and within clades are > 1.5% and < 1.5% respectively, concordant with WHO/OIE/FAO clade definition criteria.
- Full (zoomable) phylogenetic tree (PDF): The resulting phylogenetic tree color coded to highlight the various clades in the phylogram. such that percentage pairwise nucleotide distances between and within clades are > 1.5% and < 1.5% respectively, concordant with WHO/OIE/FAO clade definition criteria.
- Geographic distributions of the clades used involved
in phylogeographic annotations of infection pathways:
- All clades (zomable PDF): Geographic distributions for all 130 clades in the phylogenetic tree.
- Influential clades for Wintering Zone (zoomable PDF): Geographic distributions for just the 23 influential clades contributing annotations to infection pathways in wintering migratory season.
- Influential clades for Summering Zone (zoomable PDF): Geographic distributions for just the 13 influential clades contributing annotations to infection pathways in summering migratory season.
Results (Phase #3): Phylogeographically annotated Epidemiology Datasets
The last phase of the proposed methodology utilizes the phylogeographic data extracted in Phase 2 to identify and annotate strong infection pathways in the infection graph generated in the Phase 1. In this phase, the latitude and longitude values for each pair of verities constituting an edge in the infection graph are reverse geocoded to identify correspondence with phylogeographic data. Geocoding is performed using the GeoNames database in multiple passes using increasing radius (1/50, 1/25, and 1 mile) of matching to identify higher resolution regional-level geocodes. The resulting phylogeographically annotated infection graphs for summering and wintering zones are shown below (click on images for full sized images):
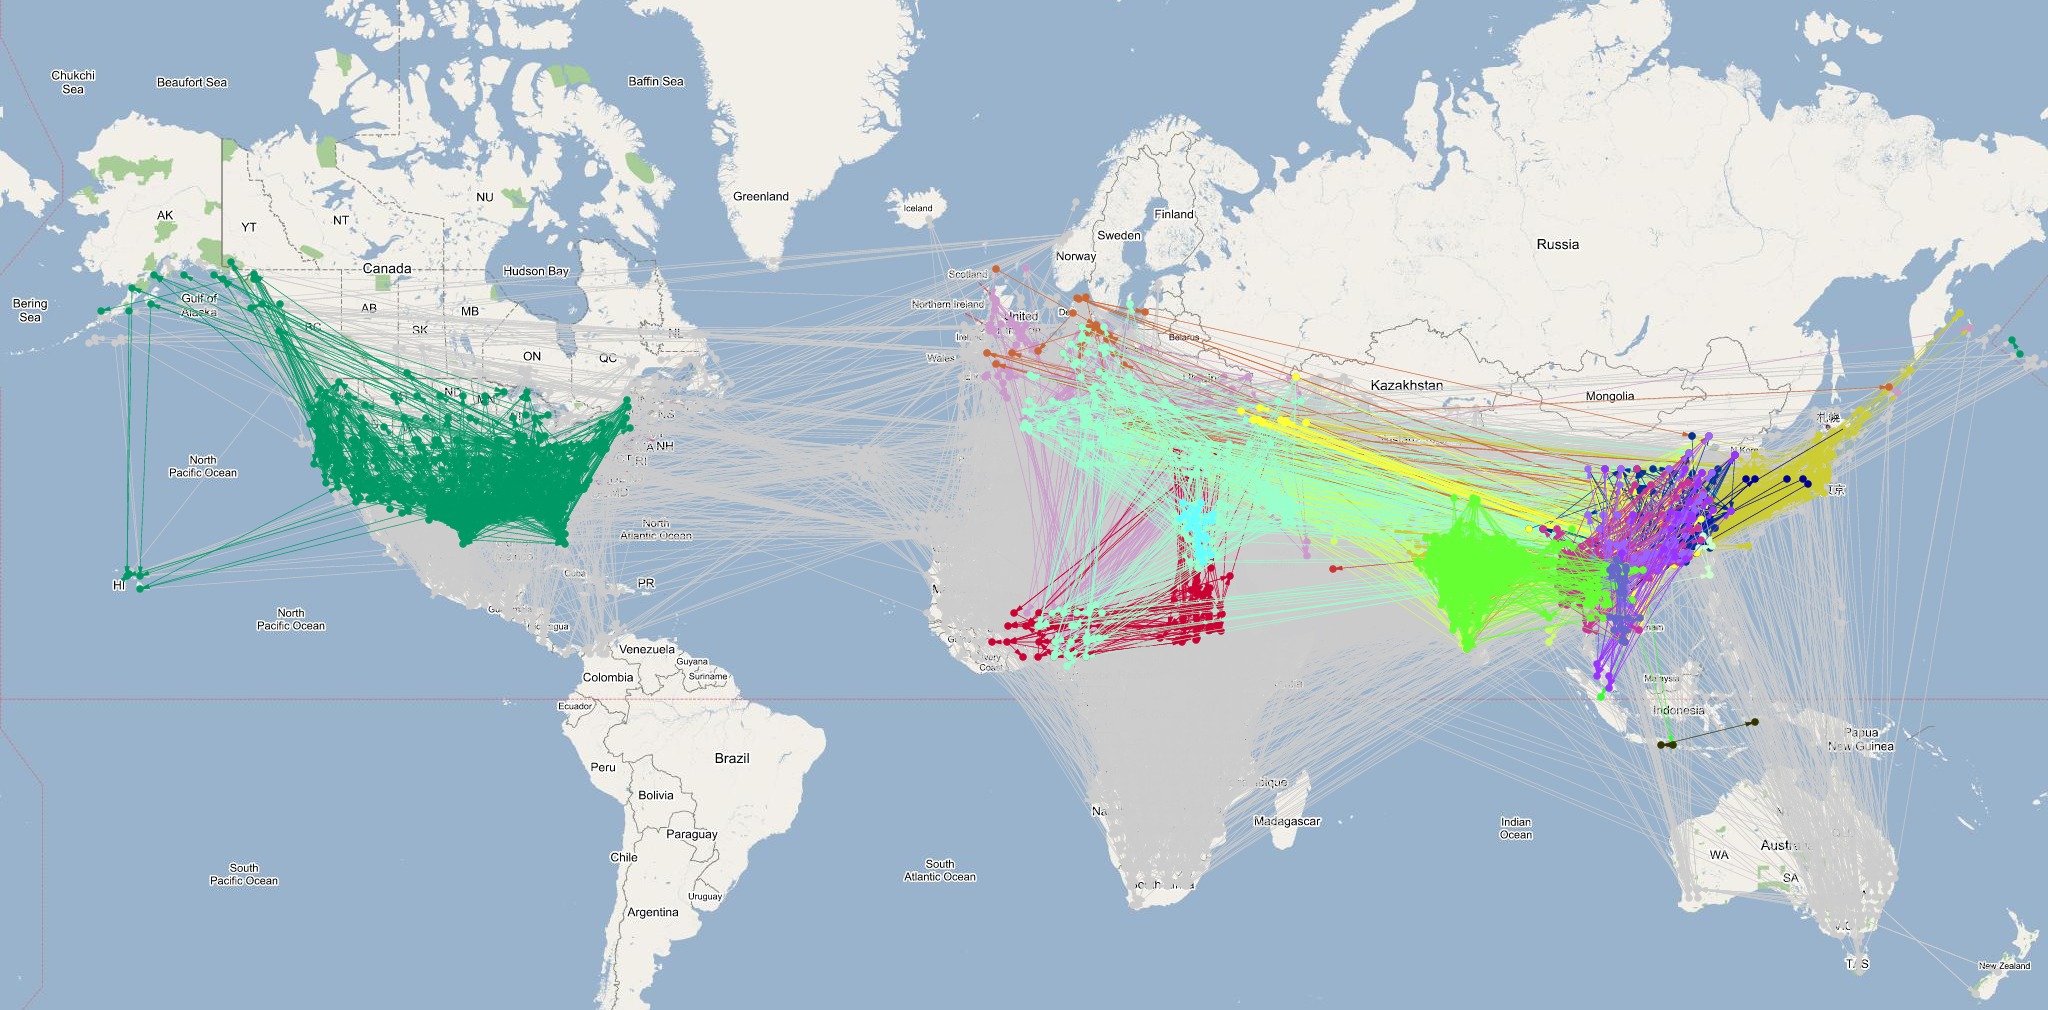
The infection graph corresponding to summering and wintering zones generated by annotating edges (infection pathways) using phylogeographic annotations are shown above. Note that these are the regions were the flocks predominantly roost and are primary locations for cross species infections. A significant variation in the number of edges annotated by influential clades between summering and wintering seasons was observed. The number of influential clades increases in wintering zone because the birds migrate down south and spread out across many countries. This time frame also coincides with increase in influenza epidemics in the temperate and subtropical regions thereby increasing the potential for reassortment between human and avian influenza viruses leading to emergent of novel and possibly highly virulent strains that cause mortality in humans. These inferences are consistent with prior investigations reported by various researchers and multinational surveillance organizations. However, the significant evidence correlating migratory patterns of high risk waterfowl species to the ``breeding grounds'' of novel H5N1 strains using phylogeographic-epidemiological analysis is an original and unique inference from this research. in addition to providing a complementary perspective on the ecological aspects of avian influenza, the inferences increase confidence in the proposed methodology.